

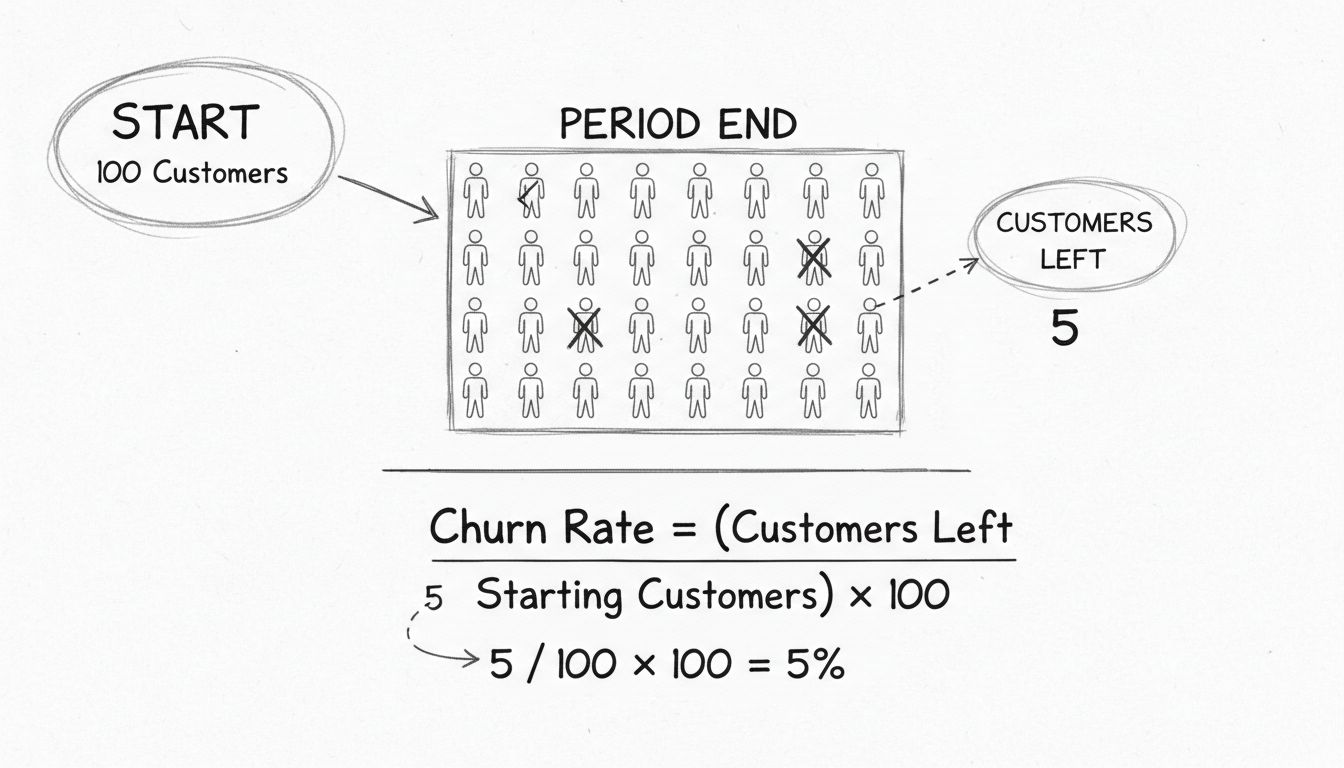
What is Customer Churn Rate? Definition, Calculation & Strategies to Reduce It
Learn what customer churn rate is, how to calculate it, and discover proven strategies to reduce churn and improve customer retention in 2025.
8 min read


Calculate customer churn, revenue churn, and net revenue retention for your subscription business. Analyze retention metrics, identify churn patterns, and understand the impact on growth and profitability.
Customer vs. Revenue Churn - Tracking both metrics provides complete picture. Customer churn shows customer satisfaction and retention effectiveness. Revenue churn shows business financial health. Ideal scenario: customer churn is positive (losing some customers) but revenue churn is negative (expansion revenue exceeds churn). This happens when: remaining customers expand usage/spend, you upsell successfully, pricing optimizations increase ARPU. Enterprise SaaS companies often achieve this - high touch customer success drives expansions faster than churn. If revenue churn exceeds customer churn, you’re losing your highest-value customers (major warning sign).
Gross vs. Net Churn - Gross churn measures only losses (customers or revenue lost). Net churn includes both losses and gains from existing customers (expansions, upsells, cross-sells). Gross churn can never be negative. Net churn can be negative when expansions exceed losses - this is the holy grail of subscription businesses. Example: 5% gross revenue churn, but 7% expansion revenue = -2% net revenue churn (growth from existing customers). Best performing SaaS companies achieve -10% to -30% net revenue churn annually. This means they can grow substantially without any new customer acquisition.
Churn Timing Patterns - Churn isn’t evenly distributed across customer lifecycle. Early churn (first 30-90 days): often 30-50% of first-year churn, caused by poor onboarding, mismatched expectations, or lack of quick wins. Mid-lifecycle churn (3-12 months): caused by failure to achieve ROI, competitor switches, or budget changes. Late lifecycle churn (12+ months): typically lowest churn period, customers are settled and integrated. Understanding timing helps prioritize interventions - most companies get highest ROI from improving first 90-day experience.
Compounding Effects - Churn compounds negatively over time. Monthly churn of 5% doesn’t mean 60% annual churn (5% × 12). It’s worse: only 54% of customers remain after 12 months (0.95^12 = 0.54). At 3% monthly churn, 69% remain after 12 months. This 15 percentage point difference (54% vs. 69%) dramatically impacts growth. If you acquire 100 new customers monthly, after 12 months with 5% churn you have 640 customers, but with 3% churn you have 830 customers - 30% more customers without changing acquisition at all.
Unit Economics and Payback - Churn determines how much you can afford to spend acquiring customers. Calculate customer acquisition cost (CAC) payback period: CAC / (Monthly Revenue × Gross Margin). With 5% churn, average customer lifetime is 20 months. With 3% churn, it’s 33 months (65% longer). This extra lifetime revenue allows higher CAC spending while maintaining healthy unit economics. Many high-growth companies focus on reducing churn before scaling acquisition because lower churn makes aggressive acquisition financially sustainable.
Onboarding Optimization - The make-or-break period. Users who don’t reach “aha moment” within first week churn at 60-80% rates. Those who do achieve quick wins churn at 5-15% rates. Effective onboarding: time to value under 5 minutes (remove friction), guided setup (checklist, tutorials, examples), early wins (show value immediately before asking work), proactive reach out (catch strugglers fast), and milestone celebrations (acknowledge progress). Track activation rate - percentage reaching key usage milestone. Optimize relentlessly. A/B test onboarding flow constantly. Improving activation from 40% to 60% can cut early churn in half.
Usage-Based Intervention - Monitor engagement metrics that predict churn. Establish “healthy usage” baseline - customers using product 3X per week have 10% churn, those using 1X per week have 40% churn. When engagement drops below threshold, intervene immediately: automated email nudges, customer success outreach, feature education, or value reminders. Build predictive churn models: users who haven’t logged in 14 days have 70% chance of churning within 60 days. Proactive intervention before they decide to leave often prevents churn. Preventing 25-50% of at-risk churns through interventions is realistic.
Track customer cohorts over time to identify trends. Create cohort table: rows are signup months (Jan 2025, Feb 2025, etc.), columns are months since signup (Month 0, Month 1, etc.), cells show retention percentage. This reveals: which cohorts retain better (improving product), seasonal patterns (do summer signups churn more?), and lifecycle patterns (does churn spike at specific times). Advanced analysis: segment cohorts by acquisition channel, plan type, or customer size to identify highest-value acquisition sources. Optimize marketing spend toward channels with best retention.
Survey churning customers systematically. Don’t just accept cancellations - understand why. Structure exit survey: required question (why are you leaving?), optional detail (what could we improve?), win-back offer (stay with discount/feature/support?), and competitive intelligence (what are you switching to?). Categorize responses: lack of value (35% - product improvement needed), cost (20% - pricing issue), better alternative (15% - competitive threat), change in needs (15% - unavoidable), technical issues (10% - product bugs), poor support (5% - customer success needed). Address top categories systematically.
Create composite health score predicting churn risk. Components: usage frequency and depth (daily active users score highest), feature adoption (using advanced features indicates stickiness), support tickets (many tickets signal problems), billing history (payment issues predict churn), engagement with communications (opening emails shows interest), and NPS or CSAT scores (satisfaction predicts renewal). Weight factors by predictive power. Classify customers: green (90-100 health, 2% churn risk), yellow (70-89 health, 10% churn risk), red (under 70, 30% churn risk). Focus customer success resources on yellow and red accounts.
Not all churn is permanent. 10-20% of churned customers can be won back. Timing matters: immediate win-back (at cancellation - offer discount, solve problem) recovers 15-25%, 30-day win-back (after they’ve been gone - new features, better pricing) recovers 5-10%, 90-day win-back (significant time passed - major product improvements) recovers 2-5%. Tailor offers to churn reason: if price was issue, offer discount; if lacking features, highlight new releases; if poor onboarding, offer dedicated success manager. Track win-back rate and ROI - these are some of your cheapest customer acquisitions.
Lock in customers with annual prepay discounts. Monthly plans have 5-7% monthly churn (40-60% annual). Annual plans have 15-25% annual churn (much lower effective monthly churn). Offer 15-20% discount for annual prepay - customers save money, you get cash upfront and reduced churn. Additional benefits: predictable revenue, reduced involuntary churn (no monthly payment failures), and higher LTV. Typical trade-off: 15% revenue discount in exchange for 50-60% churn reduction. The math strongly favors annual contracts even with significant discounts.
Grow existing customer revenue to offset churn. Expansion sources: usage-based pricing (more usage = more revenue), feature upsells (premium features, add-ons), seat expansion (more team members), and cross-sells (complementary products). Best practice: make expansion natural and automatic. Usage-based pricing where customers automatically pay more as they use more is ideal. Design pricing tiers to encourage growth - when customers hit usage limits, upgrading should be easy and valuable. Companies achieving 110-130% NRR have systematic expansion programs, not accidental upsells.
Proactive customer success reduces churn 30-50%. Model: segment customers by value, assign success managers based on segment (enterprise: dedicated manager, mid-market: pooled managers, SMB: automated success). Responsibilities: regular check-ins (quarterly business reviews for enterprise), usage monitoring (proactive outreach when engagement drops), training and education (webinars, documentation, office hours), feature advocacy (ensure customers know about relevant capabilities), and escalation management (rapidly solve issues). Calculate CS ROI: cost of CS team vs. churn reduction revenue impact. Usually 5-10X positive ROI.
Pricing structure affects churn. Considerations: value metric pricing (charge based on value delivered), good-better-best tiers (multiple options reduce “all or nothing” churn), downgrade options (let customers reduce spend rather than churn completely), usage-based overage (expensive overages cause bill shock and churn), and grandfather clauses (honor old pricing for existing customers during increases). Test pricing changes on small cohorts first - pricing mistakes can cause massive churn spikes. A 10% price increase might cause 15-20% churn spike, losing more revenue than the increase generated.
Build switching costs through: integrations (deep product integrations increase stickiness), data accumulation (years of customer data makes switching painful), network effects (value increases as more team/company uses product), training investment (users trained on your product resist learning new tools), and community (active user communities create belonging). These moats make churn economically and psychologically more difficult. Don’t rely solely on product quality - intentionally build lock-in. Ethical lock-in provides genuine value while increasing retention.
Use machine learning to predict churn before it happens. Training data: historical customer data (usage, support, billing, engagement) labeled with churn outcome. Model: predict probability of churn within next 30-90 days. Output: churn risk score for every customer. Intervention: automatically route high-risk customers to customer success for proactive engagement. Simple models (logistic regression) work surprisingly well. More sophisticated models (gradient boosting, neural networks) improve incrementally. The key is acting on predictions - perfect predictions without intervention don’t reduce churn.
Manage multiple affiliate programs and improve your affiliate partner performance with Post Affiliate Pro.
Learn what customer churn rate is, how to calculate it, and discover proven strategies to reduce churn and improve customer retention in 2025.

Free CTR calculator for affiliate marketers. Calculate click-through rates, find required clicks for target CTR, and compare campaign performance against indust...

Free landing page calculator to analyze conversion rates, calculate revenue per visitor, and optimize landing page performance. Measure traffic, conversions, an...
Join our community of happy clients and provide excellent customer support with Post Affiliate Pro.
Cookie Consent
We use cookies to enhance your browsing experience and analyze our traffic. See our privacy policy.