
Landing Page Calculator - Optimize Conversion Rates & Revenue
Free landing page calculator to analyze conversion rates, calculate revenue per visitor, and optimize landing page performance. Measure traffic, conversions, an...
8 min read


Project future sales revenue using historical data, growth rates, and seasonality. Create accurate forecasts to plan inventory, budget expenses, set targets, and make data-driven business decisions.
Forecasting Fundamentals - Effective sales forecasting balances art and science. The science: mathematical models using historical data, statistical analysis, and trend identification. The art: judgment about market changes, competitive dynamics, and business initiatives. Pure mathematical models miss market shifts. Pure judgment lacks rigor and consistency. Combine quantitative baselines with qualitative adjustments. Start with data-driven forecasts, then adjust based on known changes (new product launches, expanded sales team, market shifts). Document all assumptions so you can learn what worked and what didn’t.
Forecast Accuracy and Confidence - No forecast is perfectly accurate. Understanding your accuracy level guides decision-making. Track forecast vs. actual performance: calculate mean absolute percentage error (MAPE = |Actual - Forecast| / Actual × 100%). Forecasts under 10% MAPE are excellent, 10-20% are good, 20-30% acceptable, over 30% need methodology improvement. Accuracy varies by timeframe - near-term forecasts (next month) should hit 5-10% MAPE, long-term forecasts (next year) might be 15-25% MAPE. Express forecasts as ranges not point estimates - ‘Q2 revenue will be $400-450K’ acknowledges uncertainty better than ‘$425K.’
Trend vs. Seasonality vs. Volatility - Decompose sales data into components. Trend: underlying growth or decline direction, the signal you’re trying to amplify. Seasonality: predictable patterns repeating annually or within shorter cycles. Volatility: random fluctuations, noise you want to filter out. Example: E-commerce store grows 20% annually (trend), peaks in Q4 (seasonality), and has random daily variation (volatility). Use moving averages or exponential smoothing to reduce volatility, seasonal indices to isolate seasonality, and trend analysis to project growth. Confusing trend with seasonality or volatility leads to poor decisions.
Time Series Methods - Use historical sales data to project forward. Moving average: average last 3-12 months, smooths fluctuations but lags turns. Exponential smoothing: recent data weighted more heavily, adapts faster to changes. Linear regression: fits line through historical data, projects forward. Multiplicative models: separate trend and seasonality, then recombine. For stable businesses with 2+ years data, time series methods work well. For high-growth or changing businesses, they underperform because past isn’t prologue. Adjust mathematical forecasts for known changes.
Pipeline and Opportunity-Based Forecasting - Convert sales pipeline to revenue forecast using stage-specific probabilities. Example: 10 leads at $10K each × 10% conversion = $10K forecast, 5 qualified prospects at $15K × 40% conversion = $30K forecast, 3 proposals at $20K × 70% conversion = $42K forecast. Total pipeline forecast: $82K. This method works beautifully for B2B and complex sales with defined stages and historical conversion data. Track actual conversion rates by stage to refine probabilities. Update weekly as prospects move through pipeline. This provides the most granular and actionable forecast for sales-driven businesses.
Multi-Scenario Planning - Create three forecasts representing different futures. Conservative (pessimistic): assumes challenges, slow growth, extended sales cycles, 70% of baseline expectations. Realistic (baseline): assumes current trajectory continues with normal market conditions. Optimistic: assumes favorable conditions, quick wins, market tailwinds, 130% of baseline. Plan resources for realistic scenario, maintain flexibility to scale to optimistic if it materializes, and stress-test survival in conservative scenario. Probability-weight scenarios: 25% conservative + 50% realistic + 25% optimistic gives expected forecast. Scenarios force consideration of possibilities beyond single-point forecasts.
External Factor Integration - Incorporate external variables affecting sales. Economic indicators: GDP growth, unemployment, consumer confidence correlate with many businesses. Industry trends: trade publications, competitor performance, technology adoption curves. Seasonality factors: weather (affects retail, construction, agriculture), holidays, school calendars, tax deadlines. Competitive dynamics: new entrants, pricing changes, market consolidation. Regulatory changes: new laws affecting your industry. Build external factors into models - if unemployment rises 2%, your sales historically decline 8%, so factor that into forecasts. External awareness prevents surprise when macro trends shift.
Gather at least 12-24 months of historical sales data, more if possible. Organize by: total sales, product/category breakdown, geographic region, customer segment, and sales channel. Identify patterns: growth trend (calculate month-over-month and year-over-year growth rates), seasonality (which months/quarters are strongest), anomalies (one-time events to exclude), and inflection points (when did growth accelerate or decelerate). Clean data: remove returns/refunds, adjust for price changes, normalize for business days. Quality data foundation determines forecast accuracy.
Calculate historical growth rates to project forward. Simple approach: average last 12 months growth rate, apply to current baseline. Example: growing 3% monthly on average, current $100K/month, forecast next month $103K, following month $106.09K. More sophisticated: weight recent months more (exponential smoothing), or use regression to fit growth curve. Adjust for: market saturation (growth slows as market penetrates), capacity constraints (can’t grow faster than production allows), or market expansion (entering new markets accelerates growth). Growth rarely continues indefinitely - build deceleration into long-term forecasts.
Establish seasonal patterns from historical data. Calculate index: Month’s Sales / Average Monthly Sales. Example: December sales $200K, average monthly $100K, December index = 2.0. Once you have 24+ months data, average indices for each month. Apply to forecast: Base forecast × Seasonal index = Adjusted forecast. If projecting $120K base for December with 2.0 index, forecast $240K. Seasonal indices evolve - recalculate annually. Some businesses have multiple seasonality layers: weekly (restaurant weekend peaks) and annual (holiday peaks).
Different forecast approaches for different lifecycle stages. Introduction: slow initial sales, rapid changes, high uncertainty, forecast conservatively and update frequently. Growth: accelerating sales, invest aggressively, forecast optimistically but watch for plateau signals. Maturity: stable sales, predictable patterns, use historical models confidently. Decline: declining sales, forecast conservatively, don’t over-invest. Portfolio approach: aggregate forecasts across products at different stages. Growing products offset declining products in total forecast.
Forecast bottom-up by channel and segment. E-commerce: traffic forecast × conversion rate × average order value. Retail: foot traffic × conversion rate × basket size. B2B: pipeline value × expected close rate. Affiliate: traffic forecast × merchant conversion rate × average commission. Aggregate segment forecasts to total. This granularity reveals: which segments drive growth, where to invest resources, and which channels underperform. Total-only forecasts hide segment dynamics and miss optimization opportunities. The more granular, the more actionable (but also more time-consuming).
Track metrics that predict future sales. Website traffic leads e-commerce sales by 2-4 weeks. Email list growth predicts future campaign performance. Sales pipeline value predicts closed revenue 30-90 days forward. Social engagement predicts brand awareness and eventual sales. Manufacturing orders predict retail sales. Monitor leading indicators weekly - changes signal forecast adjustments before they show in revenue. This creates early warning system allowing proactive response rather than reactive scrambling.
Document all forecast assumptions explicitly. Market assumptions: GDP growth 3%, category growth 8%, our market share goal 2%. Operational assumptions: current conversion rates hold, no major competitor entries, planned marketing spend proceeds. Initiative assumptions: new product launches in Q2, sales team expands by 3 in Q3. When forecast deviates from actual, review assumptions to understand why. This builds institutional knowledge - what assumptions were right, which were wrong, how to forecast better next time. Undocumented assumptions prevent learning.
Maintain rolling 12-month forecasts that update monthly. Each month: add one month to forecast horizon, update all months based on latest actual results and assumptions, and compare last month’s forecast to actuals. Rolling forecasts are more useful than annual static forecasts because: they’re always current, they force regular revision, actuals inform future forecasts immediately, and they support continuous planning not just annual budgeting. Modern forecasting is continuous process, not annual event.
Use multiple forecasting methods and average results. Example: time series forecast $520K, pipeline forecast $490K, judgment forecast $510K, combined forecast $507K (average). Statistical research shows combined forecasts outperform individual methods because: they reduce method-specific errors, extreme forecasts are moderated, and no single method works best always. Weight methods by historical accuracy - if time series has been 15% MAPE, pipeline 10% MAPE, judgment 20% MAPE, weight pipeline higher. Ensemble forecasting is more robust than single-method dependency.
Leverage technology for better forecasting. Spreadsheets (Excel, Google Sheets): sufficient for most small businesses, formulas automate calculations. BI tools (Tableau, Looker, Power BI): visualize trends, interactive dashboards. Forecasting software (Anaplan, Adaptive Insights, Workday Planning): purpose-built for forecasting, collaboration, scenario planning. CRM systems (Salesforce, HubSpot): pipeline forecasting built-in. Statistical software (R, Python): advanced methods for data science teams. Start simple and add sophistication as needs grow. Process matters more than tools - good process with spreadsheets beats poor process with expensive software.
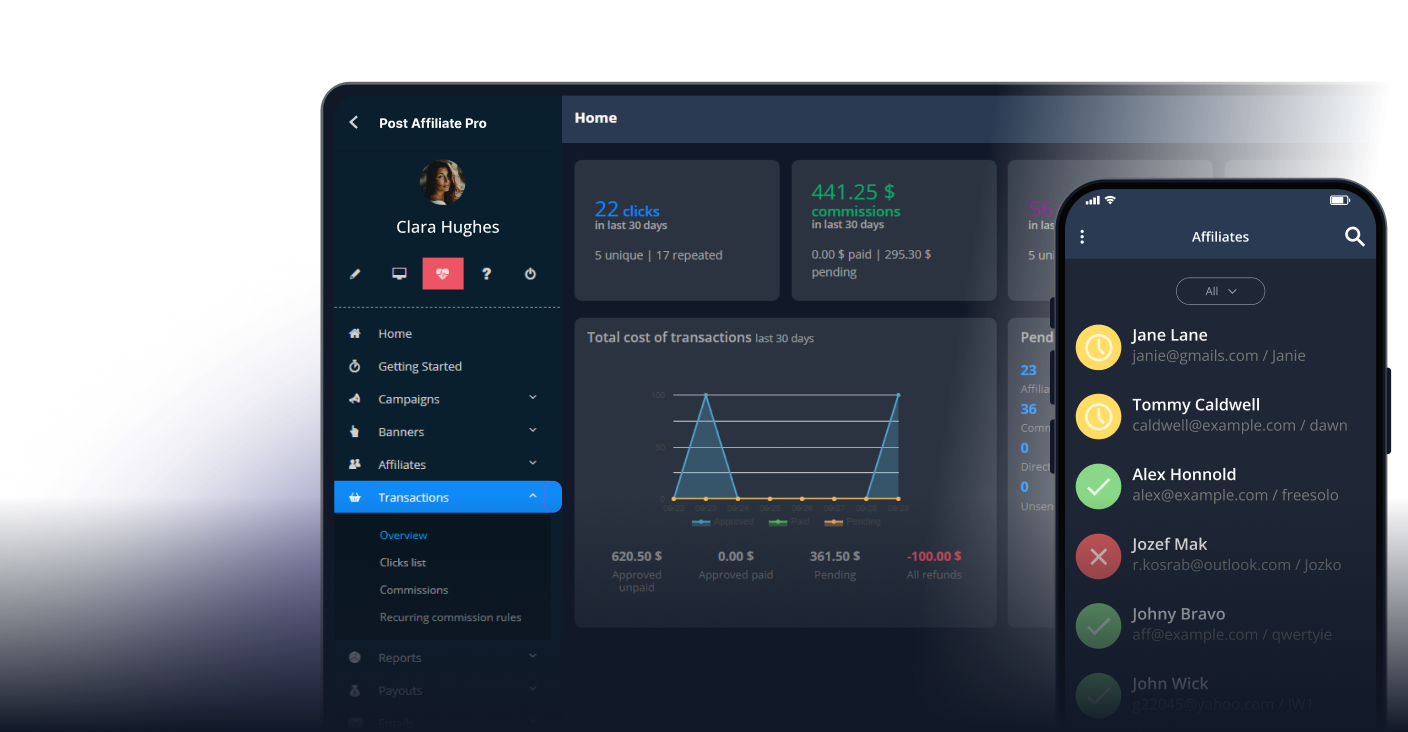
Manage multiple affiliate programs and improve your affiliate partner performance with Post Affiliate Pro.
Free landing page calculator to analyze conversion rates, calculate revenue per visitor, and optimize landing page performance. Measure traffic, conversions, an...

Free online percentage calculator with 12+ calculation modes. Calculate percentages, discounts, tips, margins, VAT, commissions, and more. Instant results with ...

Discover how to captivate your audience and boost sales with our '3-Part Sales Page Design' video. Learn to engage customers in just 30 seconds using compelling...
Join our community of happy clients and provide excellent customer support with Post Affiliate Pro.